The short answer: Better Stack is straightforward to connect to a Cloudflare Worker because Cloudflare can export OpenTelemetry logs and traces without adding an application SDK. The harder—and more important—part is deciding what production data should leave Cloudflare.
We tested the setup against SubTrack, our publicly available subscription-tracking web app deployed as a Cloudflare Worker. The app uses D1, R2, KV, scheduled jobs, Stripe, Resend, Web Push, and Sentry. That makes it a useful small-production example: there are enough moving parts to benefit from traces, but not enough traffic to justify an elaborate observability stack.
This tutorial turns that tested setup into a reproducible sequence.
- Estimated time: 25–40 minutes for the dashboard path, plus a few minutes and enough controlled requests for sampled data to appear. This is a practical estimate, not a provider SLA.
- Intended reader: A developer or operator who can deploy a Cloudflare Worker and review the telemetry it sends to a third party.
- How the two paths relate: We provisioned the tested source, destinations, and monitor through provider APIs. The numbered instructions use the dashboards because they are easier to inspect on a first setup; the collapsed
curlexamples record the equivalent API requests for repeatable provisioning.
Before You Start
This setup does not require a Better Stack SDK, but it does require access to both platforms and a deliberate decision about what telemetry can leave Cloudflare.
| Requirement | Why it is needed |
|---|---|
| Cloudflare account with Workers Observability destinations | The tested account used Workers Paid. Cloudflare’s current documentation is inconsistent about Free-plan availability, included events, and overage pricing. Confirm that Observability → Destinations is available in your account, and verify the current dashboard and contract before deployment. |
| A Better Stack account that can create an OpenTelemetry source | The source provides the ingesting host and source token used by Cloudflare. |
| Cloudflare permission to manage Workers Observability | Dashboard users need equivalent access. API users need an API token with Workers Observability Write. |
| A deployable Wrangler project | Destination references take effect only after the Worker is redeployed. |
| A reviewed telemetry boundary | Request URLs, headers, database details, and application messages can contain sensitive data. |
Three credentials have different jobs. Do not substitute one for another:
| Credential | Used for | Where it is sent |
|---|---|---|
| Better Stack Telemetry API token | Creates and manages sources. | Better Stack’s management API only. |
| Better Stack source token | Authenticates incoming OTLP logs and traces. | Stored in each Cloudflare destination’s Authorization header. |
| Cloudflare API token | Creates Workers Observability destinations. | Cloudflare’s management API only. |
If you also automate uptime monitor creation, use a separate team-scoped Better Stack Uptime API token. Never commit any of these values, paste them into screenshots, or include an API response containing a source token in a ticket or build log.
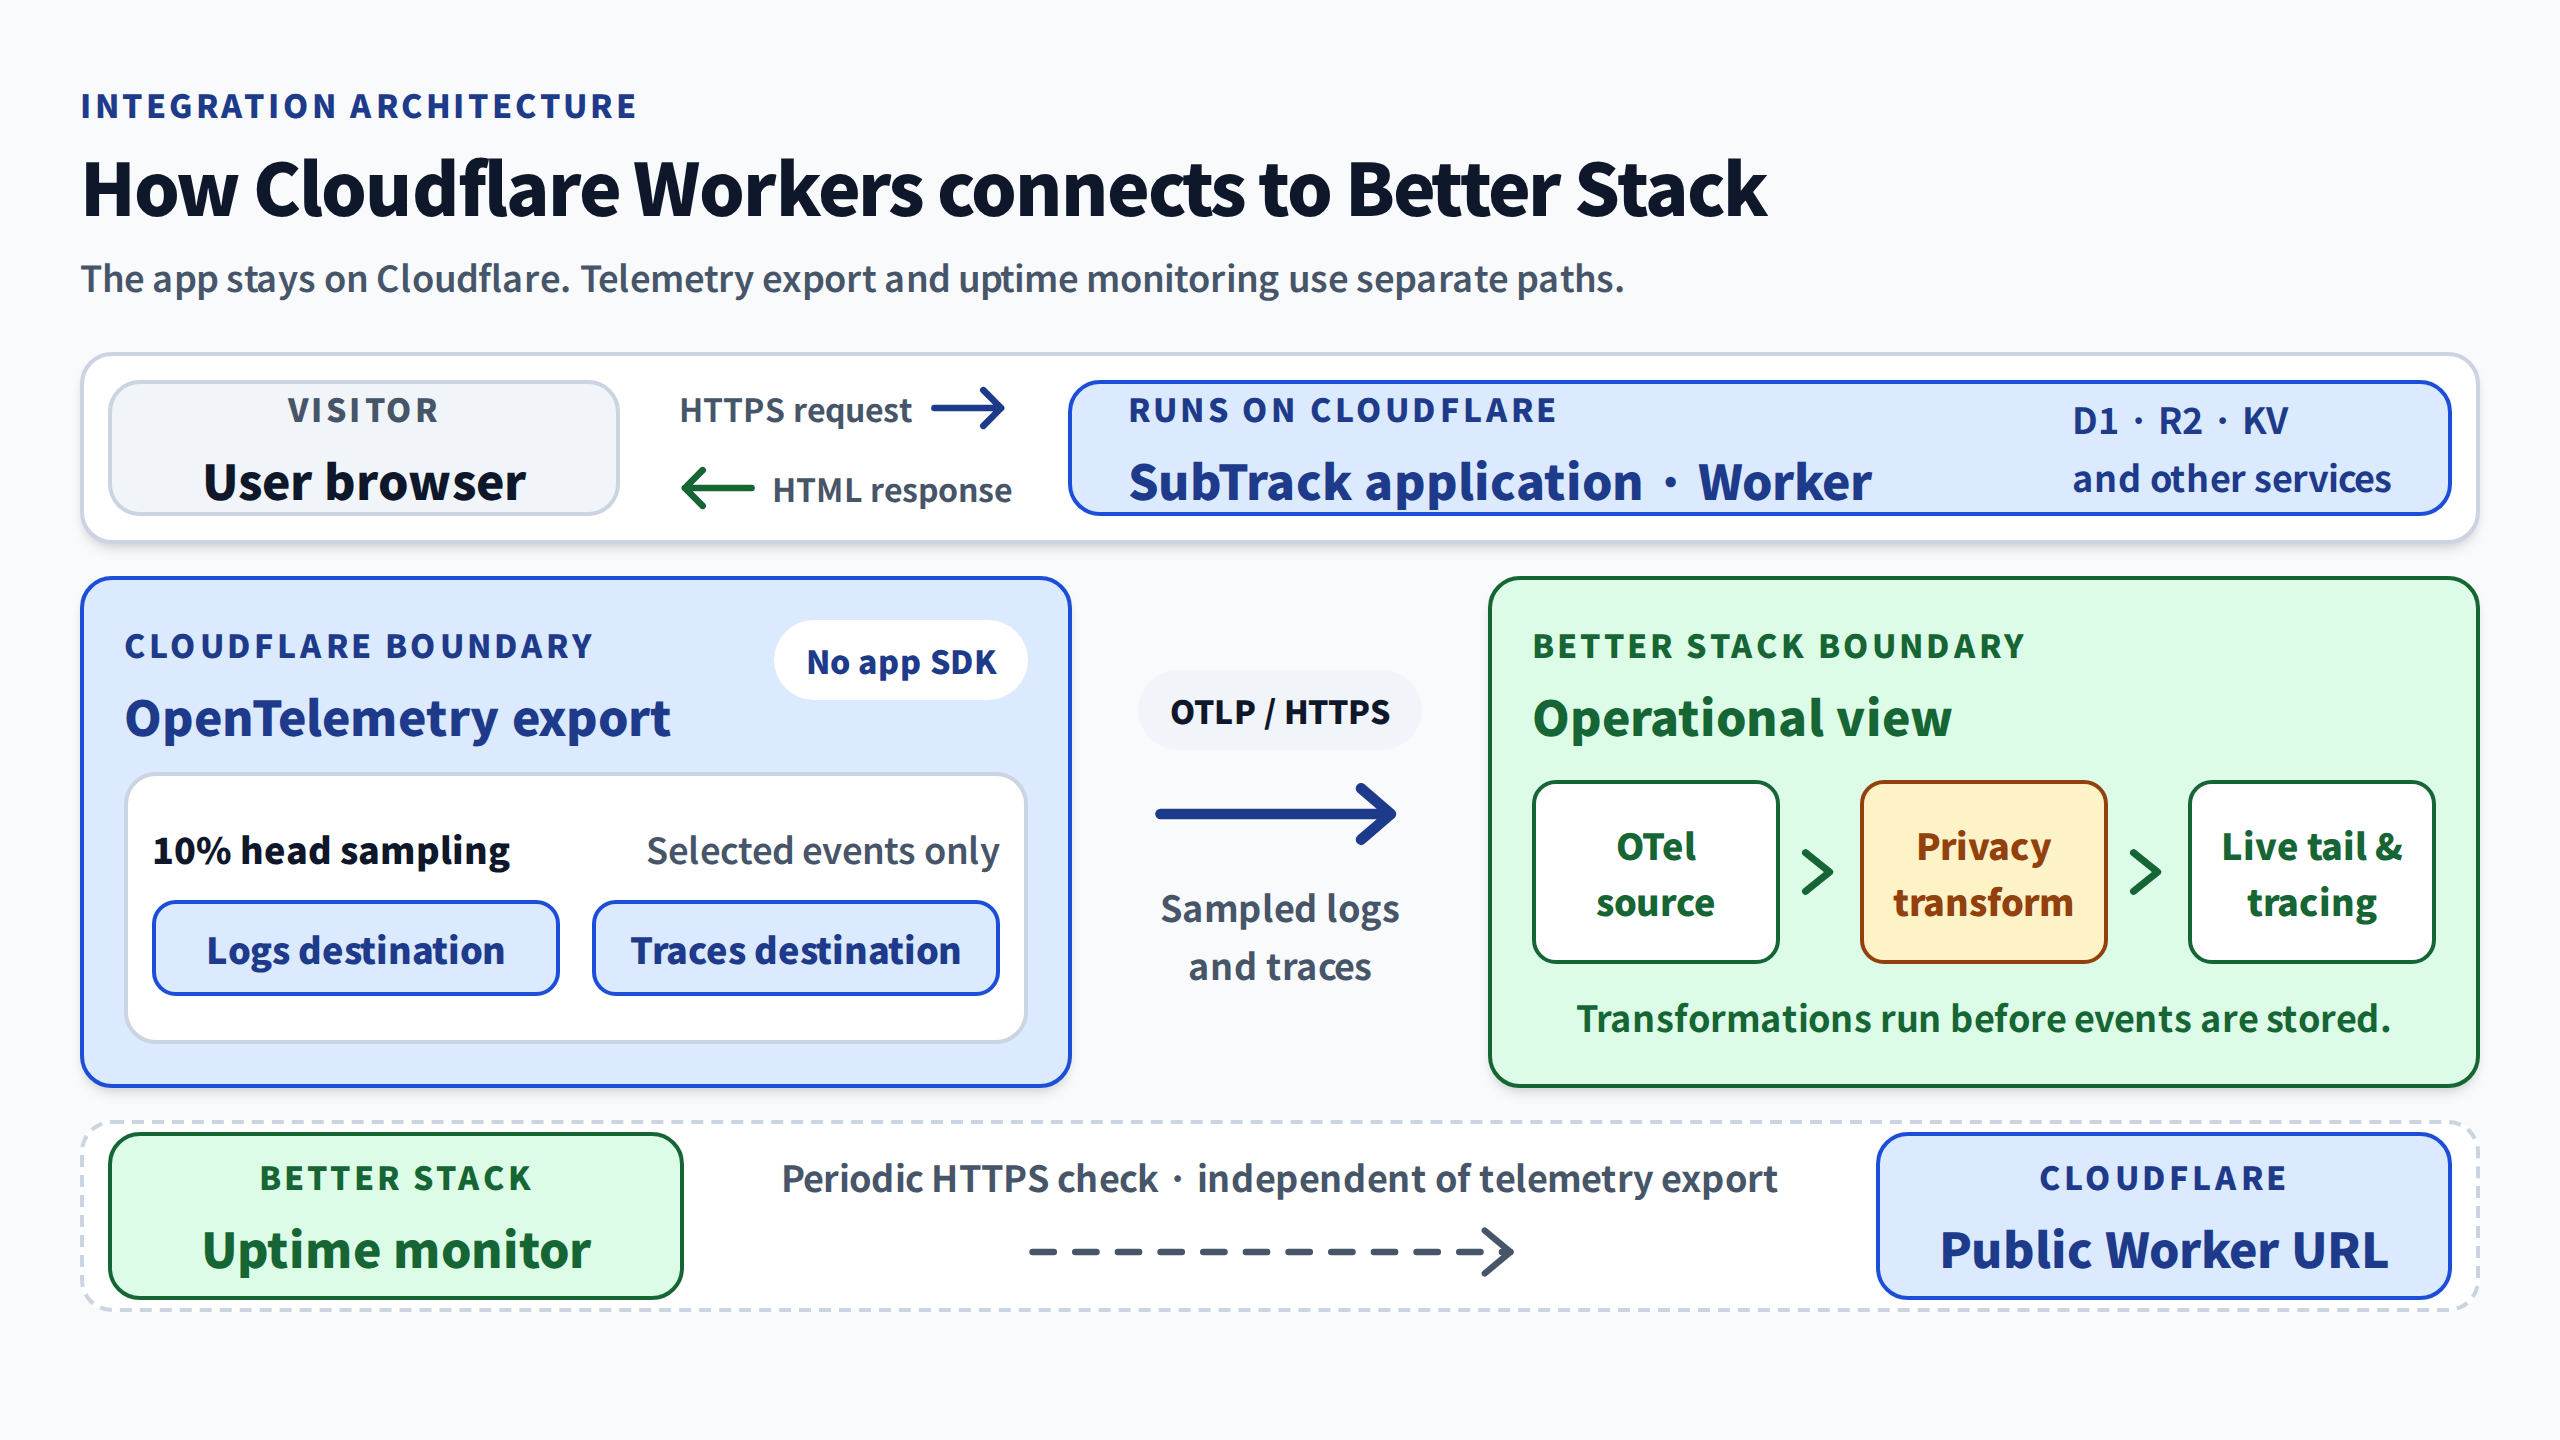
The finished path is:
- Cloudflare selects a configured sample of the Worker’s logs and traces.
- Cloudflare sends each dataset to its own OTLP destination.
- Better Stack applies the source transformations before storing the events.
- Better Stack Live tail and tracing provide the searchable operational view.
What This Tutorial Builds
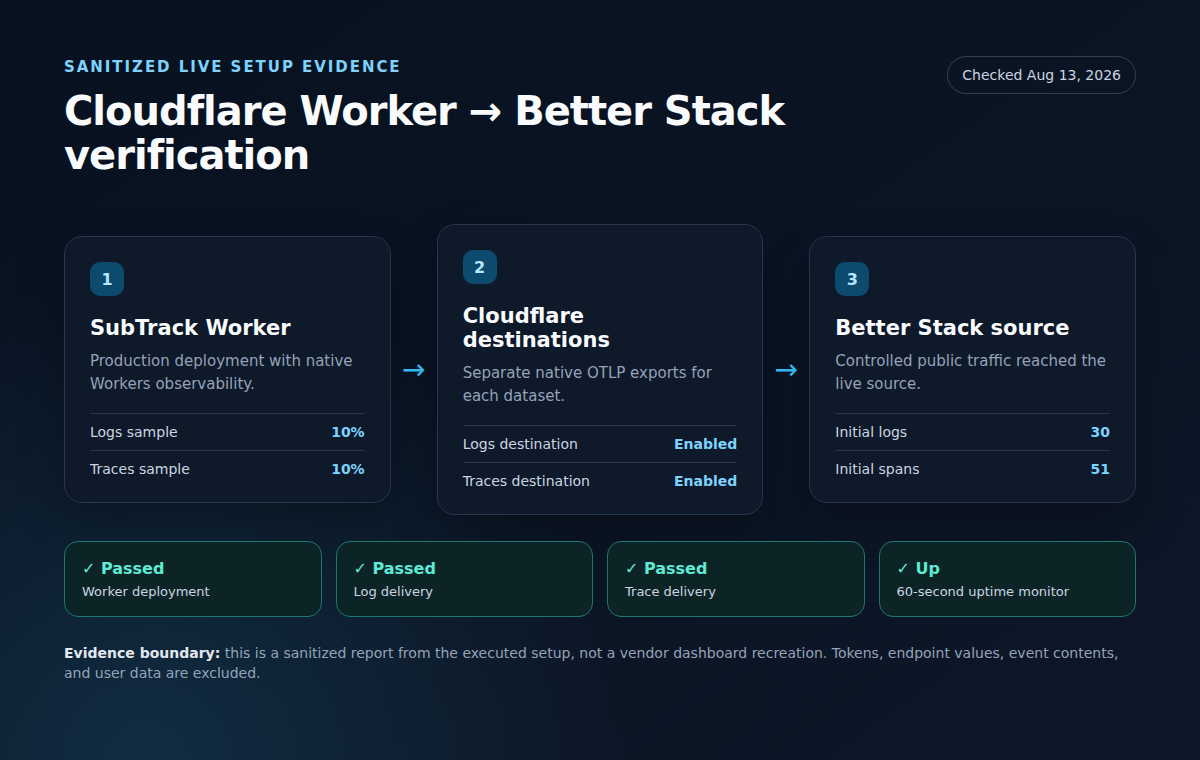
You will create one Better Stack OpenTelemetry source, one trace destination and one log destination in Cloudflare, a conservative Worker export configuration, and one independent uptime monitor. The result is a searchable operational view without adding a Better Stack SDK to the application runtime.
Why SubTrack was a useful—but limited—test workload
SubTrack already used Cloudflare Workers observability, Sentry, and an hourly scheduled Worker. Its D1, R2, KV, Stripe, Resend, and Web Push paths made automatic Worker traces useful to inspect.
The production data set contained only two confirmed test accounts and no real end users. That made controlled validation safer, but it did not prove behavior under real traffic or a real outage. Better Stack was added as an operational view; Sentry remained the error-focused tool.
Step 1: Create a Dedicated OpenTelemetry Source
We created a source named SubTrack • Cloudflare Workers through Better Stack’s Telemetry API. The source used the open_telemetry platform and the only data region available to this account, Germany.
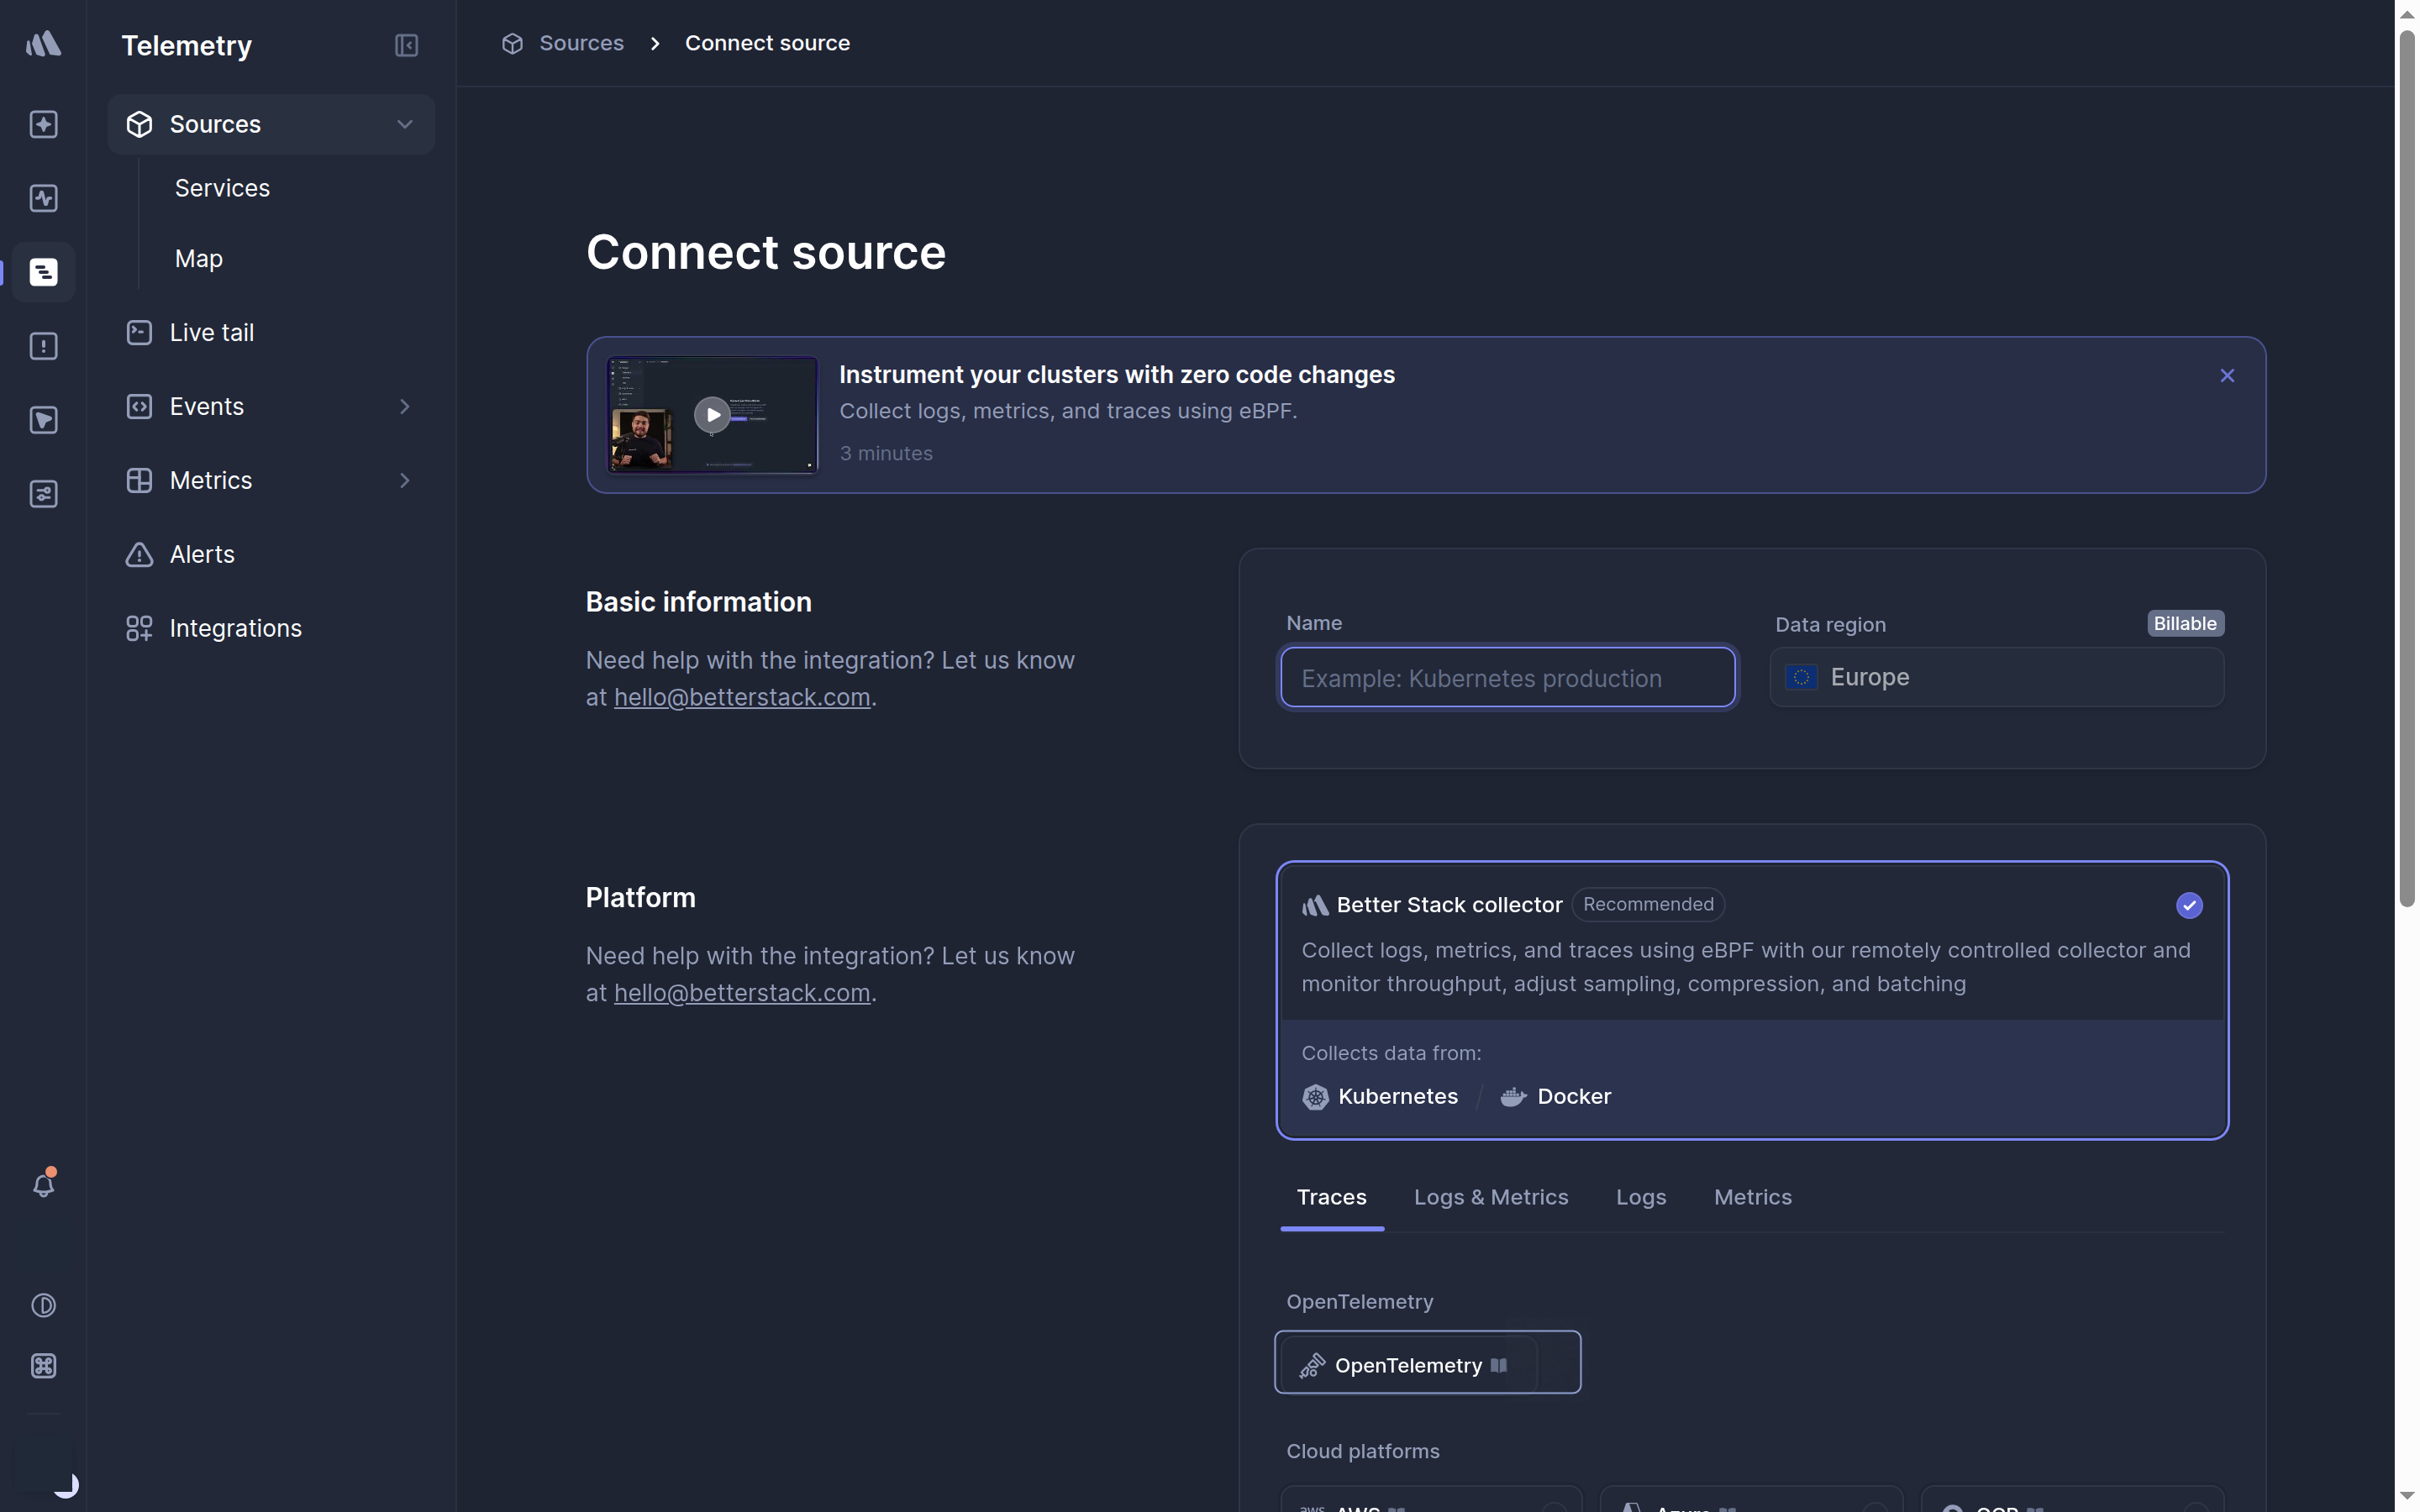
You can reproduce the same setup in the Better Stack interface:
- Open Sources and choose Connect source.
- Select OpenTelemetry.
- Give the source a name that identifies the Worker and environment.
- Keep the source page open for the Cloudflare destination setup.
Optional API path: create the source with curl
In Better Stack, open API tokens → Team-based tokens, select the team, and create a Telemetry API token. A team-scoped token is safer for this task than a global token. If you deliberately use a global token, the API also requires team_name in the request body.
Read the token without echoing it, then create the source. Change the name and choose one of the regions supported by your account: us_west, germany, or singapore.
read -rsp "Better Stack Telemetry API token: " BETTER_STACK_TELEMETRY_TOKEN
printf '\n'

curl --request POST \
  --url https://telemetry.betterstack.com/api/v2/sources \
  --header "Authorization: Bearer ${BETTER_STACK_TELEMETRY_TOKEN}" \
  --header "Content-Type: application/json" \
  --data '{
    "name": "My Worker - production",
    "platform": "open_telemetry",
    "data_region": "germany"
  }'

unset BETTER_STACK_TELEMETRY_TOKEN
A successful response includes attributes.ingesting_host and attributes.token. Treat the complete response as a secret because the second field is the source token. Do not rerun the POST merely to retrieve those values; check the existing source first.
The API returned two connection values required by Cloudflare:
- An ingesting host
- A source token
The source is ready when it appears in the source list and shows both connection values. It will remain empty until the Cloudflare destinations are connected and the Worker receives sampled traffic.
The resulting source reported three days of log retention for this account. Treat that as an observed account setting, not a promise about every Better Stack plan. Check the current Better Stack pricing page and your source configuration before estimating retention or cost.
Step 2: Add Privacy Transformations Before Ingestion
Cloudflare can generate useful attributes automatically, including request URLs and spans for services such as D1, R2, and KV. Those same details can contain information that should not be stored in another provider.
Configure the transformation before activating Cloudflare export:
- Open Sources.
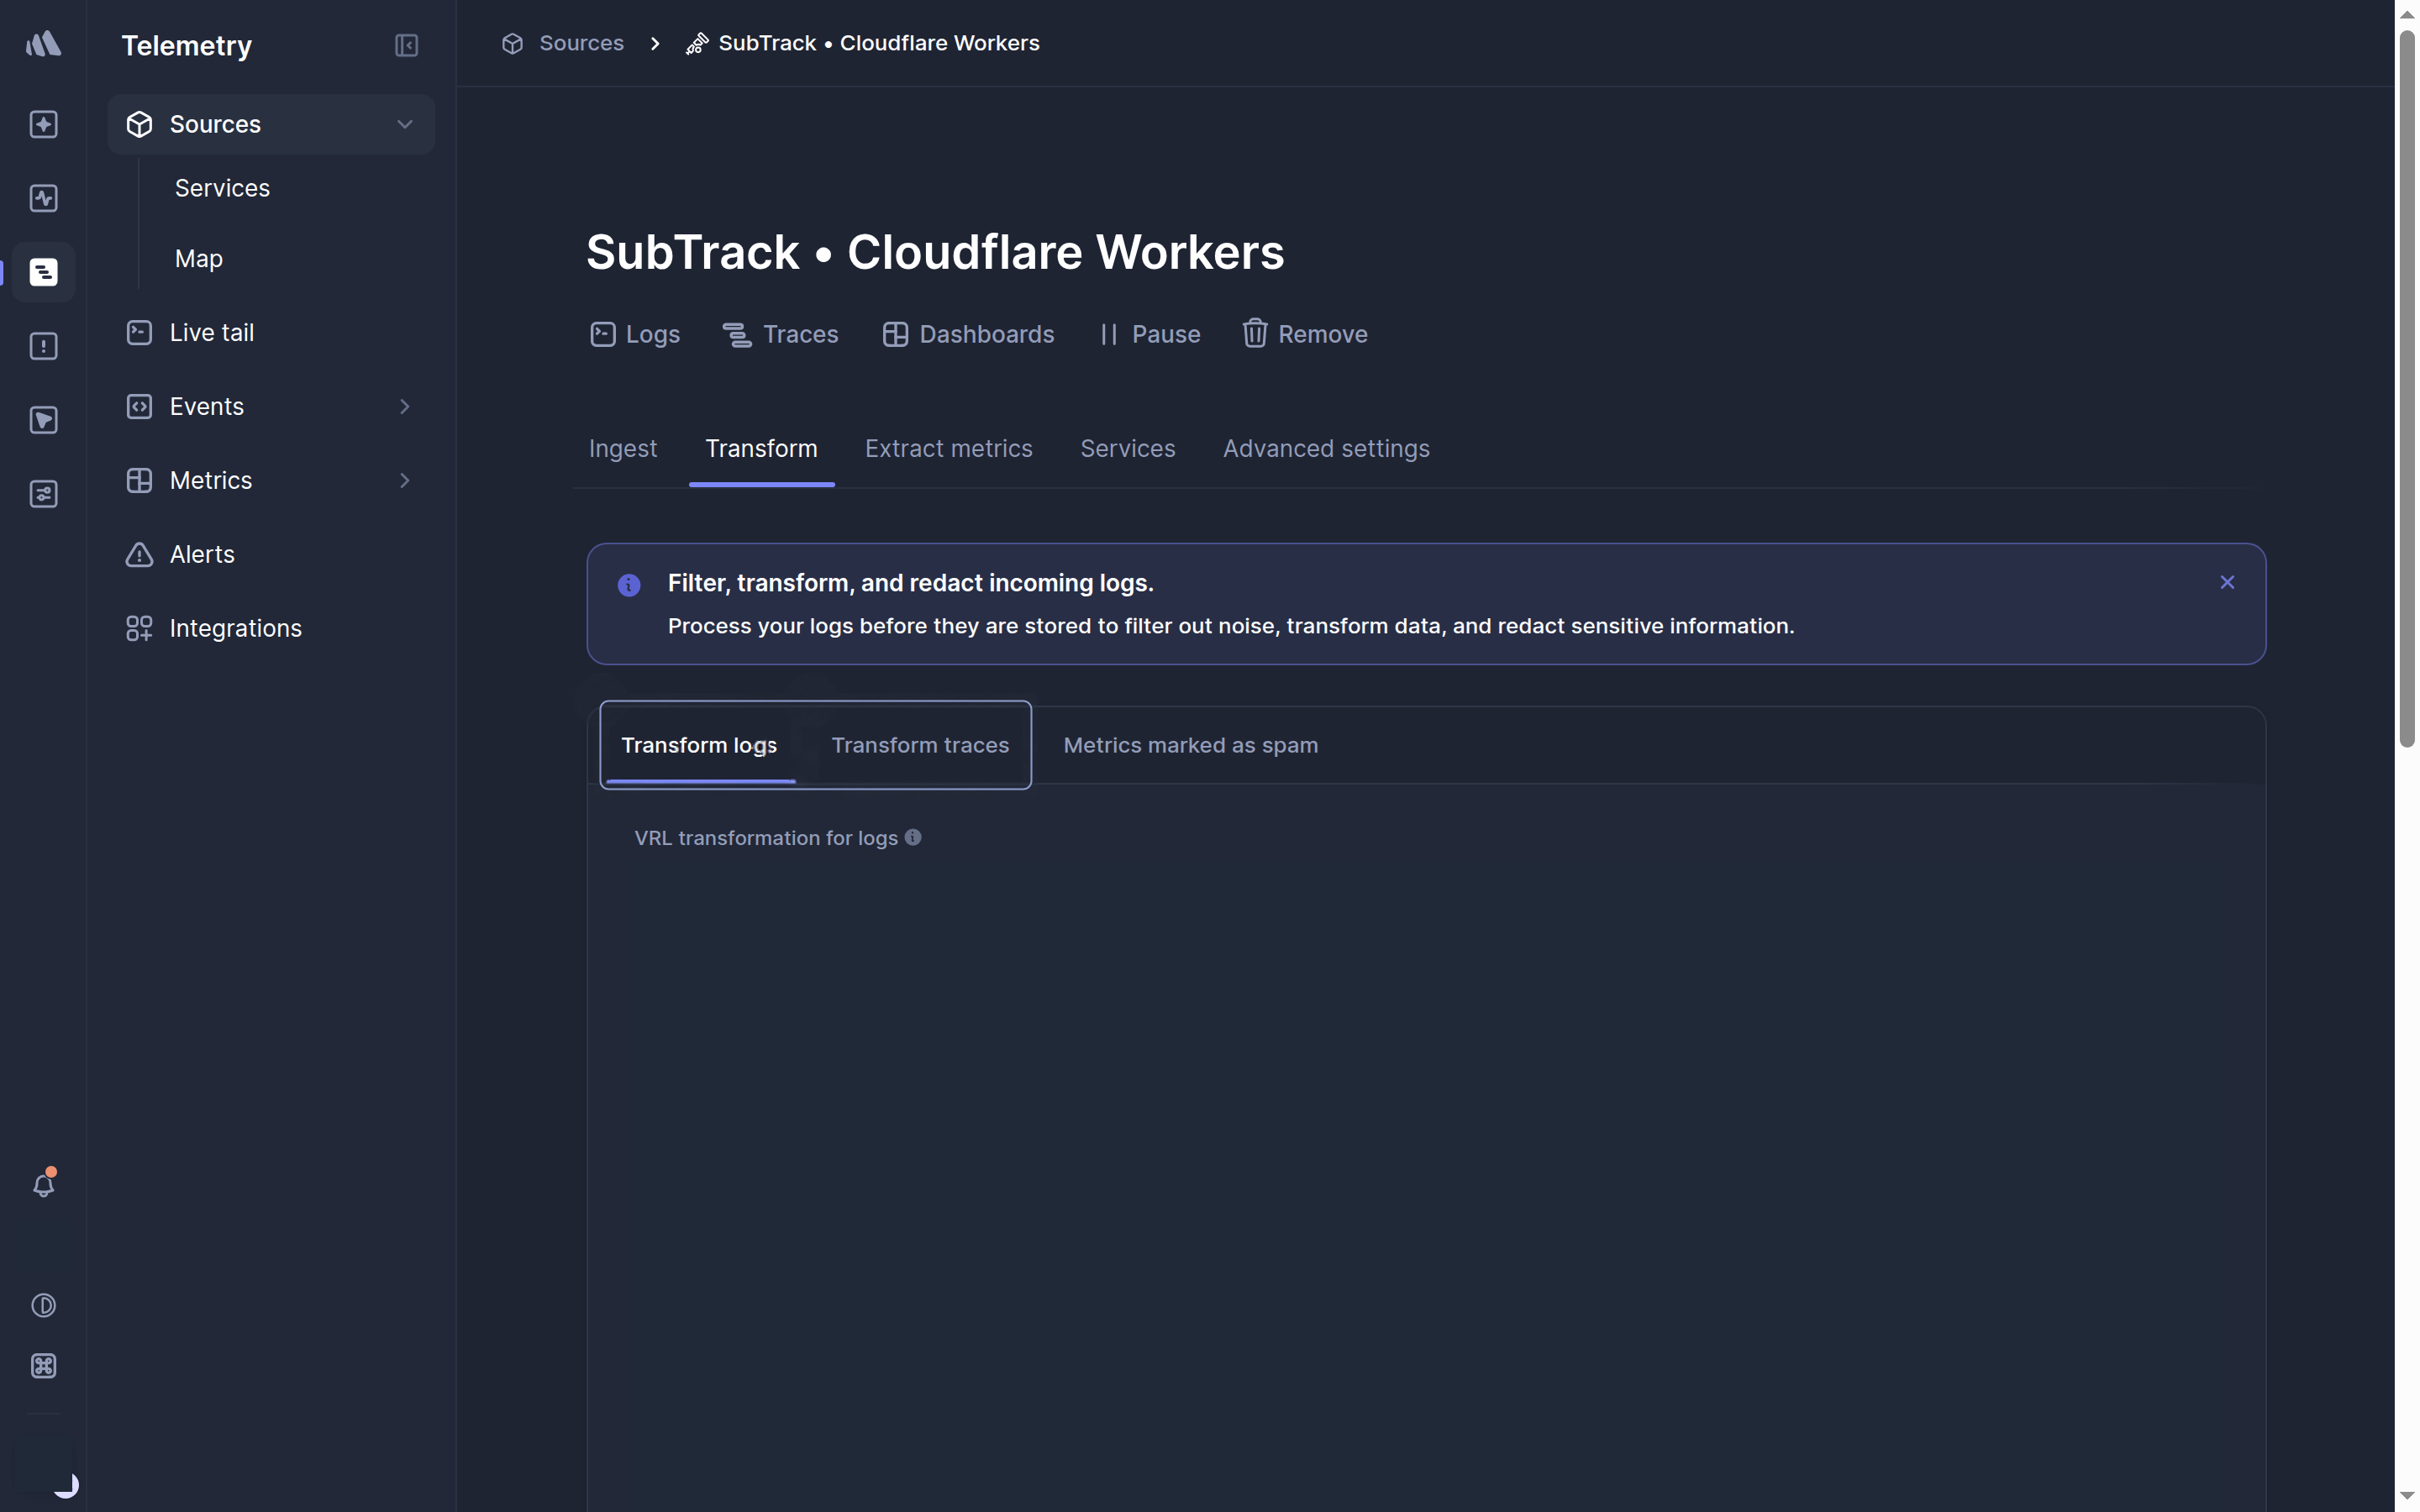
- Open the source row menu, choose Configure, then open Transform.
- Select Transform logs, paste the reviewed VRL rule below, and choose Test transformation with a representative log event.
- Confirm that the protected fields are absent and
_ingest.transform_erroris not present, then save. - Select Transform traces and repeat the same test and save process with a representative span.
The transformation removes or masks:
- Authorization and Cookie values at expected attribute paths
- Complete URLs and URL query strings
- Database query text
- E-mail addresses
- IPv4 and IPv6 addresses
This is the final version used for the tested fields. It covers both the common OpenTelemetry attribute shape and the span.attributes wrapper observed in the live Cloudflare payload:
# Common OpenTelemetry attribute paths
del(.attributes."http.request.header.authorization")
del(.attributes."http.request.header.cookie")
del(.attributes."url.full")
del(.attributes."url.query")
del(.attributes."db.query.text")

# Cloudflare span paths observed in this setup
del(.span.attributes."http.request.header.authorization")
del(.span.attributes."http.request.header.cookie")
del(.span.attributes."url.full")
del(.span.attributes."url.query")
del(.span.attributes."db.query.text")

email_pattern = r'[A-Za-z0-9._%+-]+@[A-Za-z0-9.-]+\.[A-Za-z]{2,}'
ipv4_pattern = r'\b(?:\d{1,3}\.){3}\d{1,3}\b'
ipv6_pattern = r'\b(?:(?:[A-Fa-f0-9]{1,4}:){7}[A-Fa-f0-9]{1,4}|(?:[A-Fa-f0-9]{1,4}:){1,7}:|:(?::[A-Fa-f0-9]{1,4}){1,7})\b'

. = redact(., filters: [email_pattern, ipv4_pattern, ipv6_pattern])
Do not activate export until both tabs have a saved, successful test. Better Stack’s source API also accepts vrl_transformation_logs and vrl_transformation_spans, but the dashboard test is recommended for a first setup because it shows the transformed event before you store live traffic.
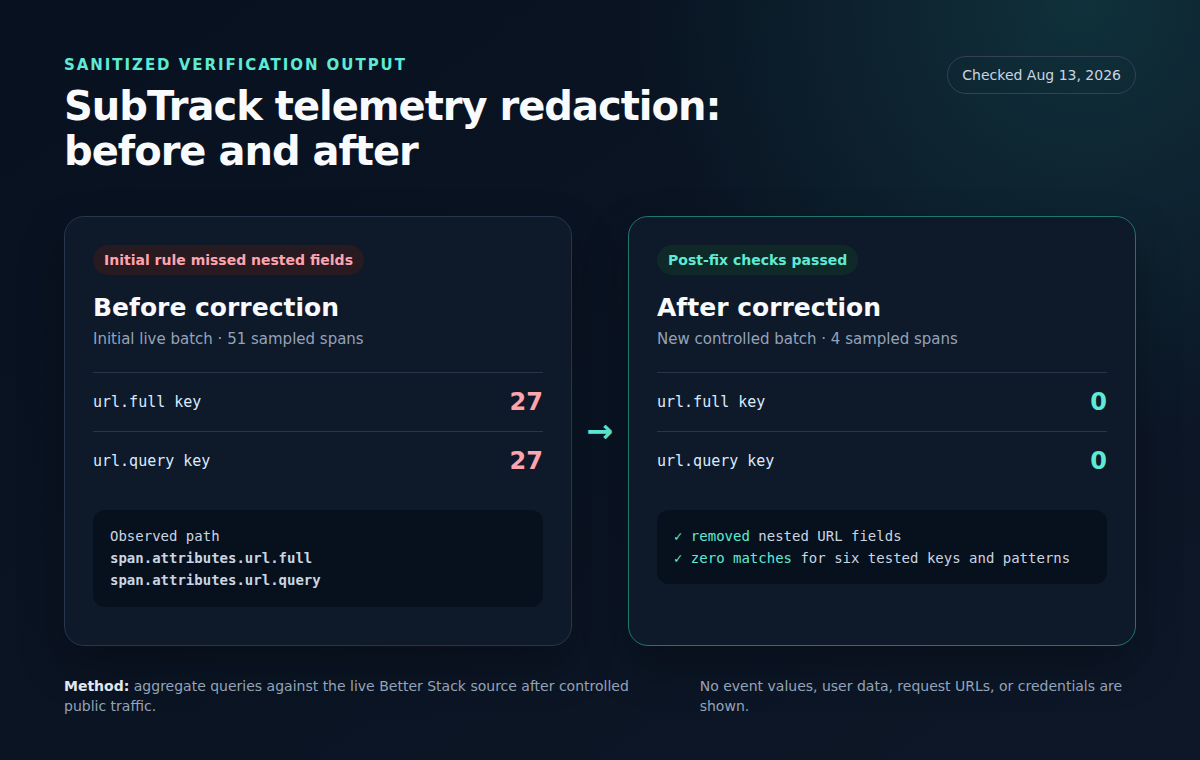
Better Stack documents that VRL transformations run before data is ingested and stored. That reduces storage exposure, but it does not remove the transfer risk or cover unknown fields automatically. The span.attributes paths above are included because the first live Cloudflare payload nested the protected fields there; the measured before-and-after result is recorded in Observed Results and Test Limits.
Step 3: Create Two Cloudflare OTLP Destinations
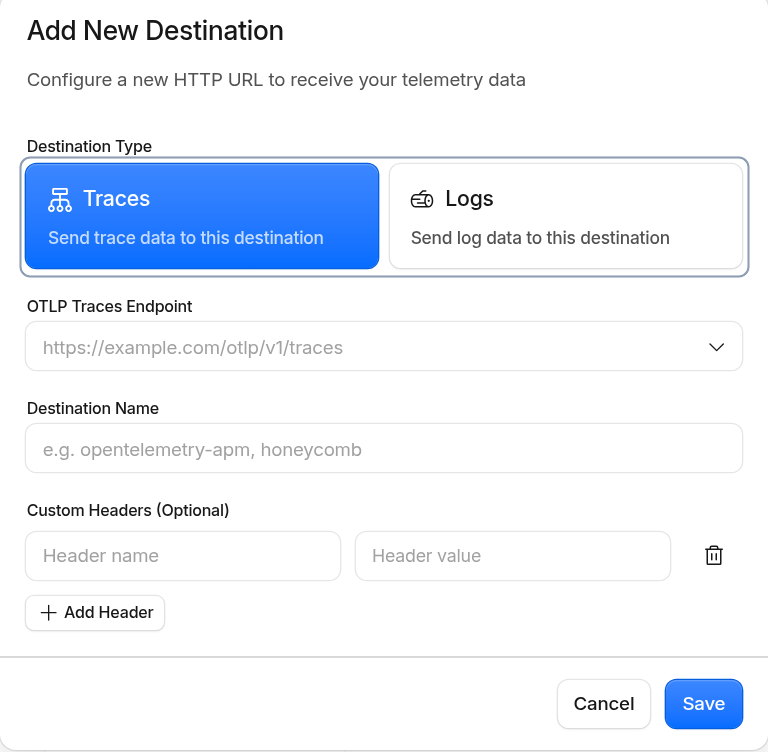
Cloudflare requires separate destinations for traces and logs. In the current account dashboard, open Build → Observability, select the Destinations tab, then choose Add Destination once for each dataset:
| Field | Trace destination | Log destination |
|---|---|---|
| Destination name | betterstack-subtrack-traces |
betterstack-subtrack-logs |
| Destination type | Traces | Logs |
| OTLP endpoint | https://INGESTING_HOST/v1/traces |
https://INGESTING_HOST/v1/logs |
| Custom header name | Authorization |
Authorization |
| Custom header value | Bearer SOURCE_TOKEN |
Bearer SOURCE_TOKEN |
Replace INGESTING_HOST and SOURCE_TOKEN with the values shown by the Better Stack source. The destination is ready when Cloudflare lists it as enabled. After traffic starts, its status should change from Never run to a recent successful-delivery time.
Optional API path: create both Cloudflare destinations with curl
Create a Cloudflare API token restricted to the target account with Workers Observability Write. Copy your account ID, Better Stack ingesting host, and Better Stack source token. The host value should not include https://.
export CLOUDFLARE_ACCOUNT_ID="replace-with-your-account-id"
export BETTER_STACK_INGESTING_HOST="replace-with-your-ingesting-host"

read -rsp "Cloudflare API token: " CLOUDFLARE_API_TOKEN
printf '\n'
read -rsp "Better Stack source token: " BETTER_STACK_SOURCE_TOKEN
printf '\n'
Create the trace destination:
curl --request POST \
  --url "https://api.cloudflare.com/client/v4/accounts/${CLOUDFLARE_ACCOUNT_ID}/workers/observability/destinations" \
  --header "Authorization: Bearer ${CLOUDFLARE_API_TOKEN}" \
  --header "Content-Type: application/json" \
  --data @- <<EOF
{
  "name": "betterstack-subtrack-traces",
  "enabled": true,
  "configuration": {
    "type": "logpush",
    "logpushDataset": "opentelemetry-traces",
    "url": "https://${BETTER_STACK_INGESTING_HOST}/v1/traces",
    "headers": {
      "Authorization": "Bearer ${BETTER_STACK_SOURCE_TOKEN}"
    }
  }
}
EOF
Create the log destination:
curl --request POST \
  --url "https://api.cloudflare.com/client/v4/accounts/${CLOUDFLARE_ACCOUNT_ID}/workers/observability/destinations" \
  --header "Authorization: Bearer ${CLOUDFLARE_API_TOKEN}" \
  --header "Content-Type: application/json" \
  --data @- <<EOF
{
  "name": "betterstack-subtrack-logs",
  "enabled": true,
  "configuration": {
    "type": "logpush",
    "logpushDataset": "opentelemetry-logs",
    "url": "https://${BETTER_STACK_INGESTING_HOST}/v1/logs",
    "headers": {
      "Authorization": "Bearer ${BETTER_STACK_SOURCE_TOKEN}"
    }
  }
}
EOF

unset CLOUDFLARE_API_TOKEN BETTER_STACK_SOURCE_TOKEN
unset CLOUDFLARE_ACCOUNT_ID BETTER_STACK_INGESTING_HOST
Both responses should report success: true, with the expected name and dataset. Check the destination list before rerunning either POST so you do not create an unnecessary duplicate. If you change these names, make the identical change in the Wrangler configuration below.
Creating a destination does not start export. The Worker must reference the destination names in its Wrangler configuration and be redeployed.
Step 4: Use Conservative Worker Sampling
Better Stack’s quick-start example uses a sampling rate of 1.0, which exports every selected event. That is useful for a short controlled test, but it was not the default we wanted for a production app.
The deployed SubTrack configuration uses 10% sampling for logs and traces:
File: wrangler.toml in the SubTrack project root
Add or update the following block in the same Wrangler configuration file that deploys your Worker. If your project uses wrangler.jsonc instead, add the equivalent keys there rather than creating a second configuration file.
[observability]
enabled = true

[observability.traces]
enabled = true
destinations = ["betterstack-subtrack-traces"]
head_sampling_rate = 0.1
persist = false

[observability.logs]
enabled = true
invocation_logs = true
destinations = ["betterstack-subtrack-logs"]
head_sampling_rate = 0.1
persist = false
What each Wrangler setting does
| Setting | Effect |
|---|---|
[observability] and enabled = true | Enables Workers observability for this Worker. Tracing is still enabled explicitly in the traces section below. |
[observability.traces] and enabled = true | Turns on Cloudflare’s automatic Worker tracing. |
destinations = [“betterstack-subtrack-traces”] | Exports traces to the trace destination created in Cloudflare. The value must exactly match that destination’s name. |
head_sampling_rate = 0.1 under logs and traces | Selects approximately 10% of requests for each signal. The two decisions are independent, so rare requests can be missed and matching logs and traces are not guaranteed. |
persist = false under logs and traces | Exports selected telemetry without retaining a duplicate copy in Cloudflare’s Workers Logs or Traces view. |
[observability.logs] and enabled = true | Turns on Worker logging for this configuration. |
invocation_logs = true | Includes Cloudflare-generated invocation logs with request, response, and related execution metadata. Application logs such as console.log() are separate log events. |
destinations = [“betterstack-subtrack-logs”] | Exports logs to the separate log destination created in Cloudflare. This must match the dashboard name exactly. |
Treat 10% as a starting point, not a universal recommendation. It reduces exported volume, but costs do not necessarily fall by exactly 90% because one selected request can create multiple events or spans. Replace the example destination names with the exact names in your account, then adjust sampling only after reviewing traffic, coverage, and current provider pricing.
Cloudflare’s current documentation is inconsistent about Free-plan availability, included events, and overage pricing as of August 18, 2026. The figures used for this setup follow the dedicated OTel export page: export unavailable on Workers Free, 10 million trace events plus 10 million log events per month on Workers Paid, and $0.05 per additional million. However, the Workers Traces page says billing begins October 1, 2026 and lists 200,000 events per day on Free, 20 million per month on Paid, and $0.60 per additional million. Do not use either table alone as a production cost estimate. Verify the current dashboard and contract before deployment.
Deploy the updated Worker configuration:
npx wrangler whoami
npx wrangler deploy
The first command confirms that Wrangler is authenticated to the intended Cloudflare account. The configuration is active when deployment succeeds and the Worker’s observability settings show both destination names with a 0.1 sampling rate. With 10% head sampling, a quiet Worker may need several requests before one is exported.
Step 5: Add a Live Uptime Monitor
Uptime monitoring does not require Worker telemetry export, so we enabled it separately. Better Stack treats a 2XX response as successful for the monitor type used here.
Open Monitors → Create monitor. The empty form below shows the availability condition and URL field used in this step.
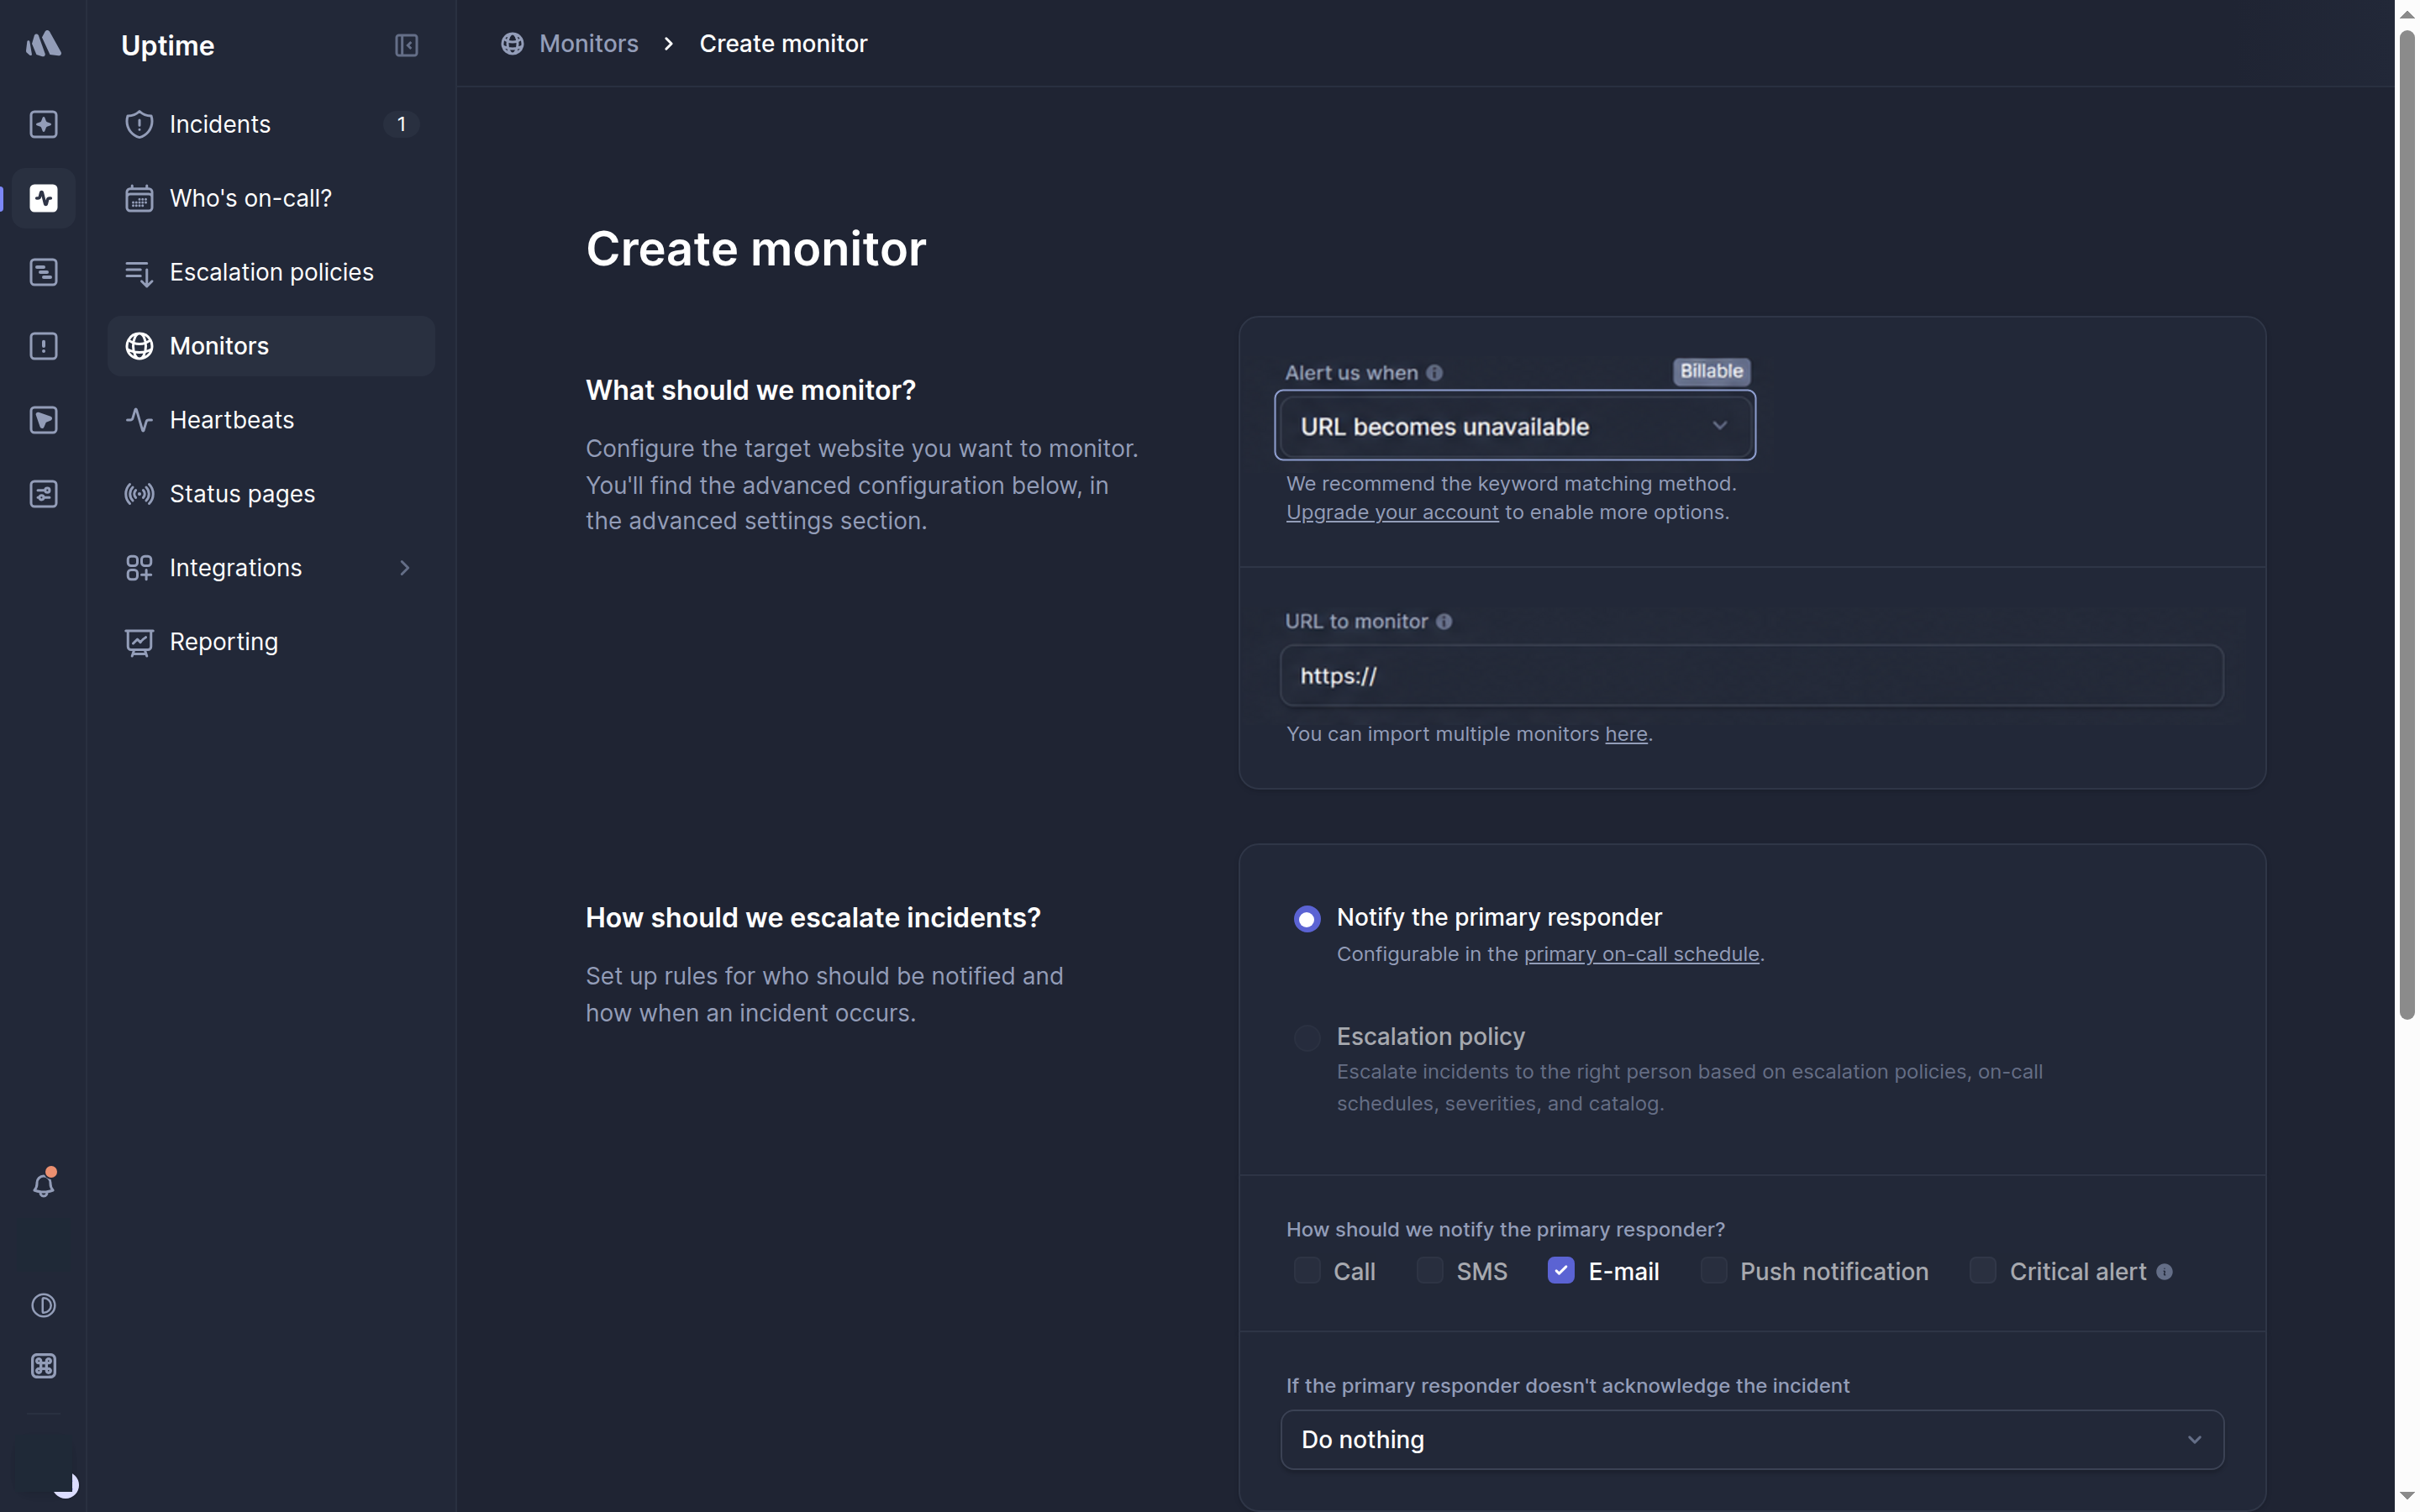
The monitor checks the English SubTrack production homepage:
https://subtracknotify.com/en/Configure the dashboard form as follows:
- Open Monitors → Create monitor and choose URL becomes unavailable.
- Enter the public URL and a recognizable monitor name.
- Set the check frequency to 60 seconds.
- Select the Asia, Europe, and US regions.
- Keep TLS certificate verification enabled and enable e-mail alerts.
- In the advanced incident settings, set the confirmation period to 120 seconds and the recovery period to 60 seconds.
- Set the TLS expiration warning to 7 days, then create the monitor.
Optional API path: create the uptime monitor with curl
In Better Stack, open API tokens → Team-based tokens, select the team, and create an Uptime API token. Replace the URL below before running the request.
export WORKER_HEALTH_URL="https://your-worker.example.com/health"
read -rsp "Better Stack Uptime API token: " BETTER_STACK_UPTIME_TOKEN
printf '\n'

curl --request POST \
  --url https://uptime.betterstack.com/api/v2/monitors \
  --header "Authorization: Bearer ${BETTER_STACK_UPTIME_TOKEN}" \
  --header "Content-Type: application/json" \
  --data @- <<EOF
{
  "monitor_type": "status",
  "url": "${WORKER_HEALTH_URL}",
  "pronounceable_name": "My Worker production health",
  "email": true,
  "check_frequency": 60,
  "regions": ["us", "eu", "as"],
  "verify_ssl": true,
  "confirmation_period": 120,
  "recovery_period": 60,
  "ssl_expiration": 7
}
EOF

unset BETTER_STACK_UPTIME_TOKEN WORKER_HEALTH_URL
A successful request returns HTTP 201 and a monitor object. Confirm that its URL, regions, frequency, and alert settings match the intended public endpoint before relying on it.
After creating the monitor, wait for it to move from pending to up. An up state confirms only that Better Stack reached this public URL and received a successful response; application workflows need separate checks.
Step 6: Verify the End-to-End Setup
Do not stop at a successful deployment. Verify delivery, field removal, and uptime separately:
- Send several controlled requests to a public Worker route. At 10% sampling, continue generating traffic if the first few requests do not appear.
- Open Logs & traces → Live tail, select the new source, and confirm that at least one log and one span arrive.
- Open a trace and confirm that its spans and associated log lines can be inspected together.
- In the span attributes, check that the following fields are absent. You can also add them as custom columns to make repeated checks easier:
span.attributes["url.full"]
span.attributes["url.query"]
span.attributes["db.query.text"]- Run these Live tail searches separately. Each should return no results for the controlled post-transformation batch:
fulltext=~/Bearer\s+[A-Za-z0-9._~+\/-]+/ifulltext=~/[A-Za-z0-9._%+-]+@[A-Za-z0-9.-]+\.[A-Za-z]{2,}/fulltext=~/\b(?:\d{1,3}\.){3}\d{1,3}\b/- Return to Cloudflare’s Telemetry destinations. A recent successful-delivery time proves that Cloudflare reached the endpoint; Never run or Error requires investigation.
- Open the Better Stack monitor and confirm that its status is
up.
A zero-result search only covers the selected source, time range, and sampled traffic. Repeat these checks after adding new routes, changing log messages, or receiving a materially different Cloudflare event shape.
Observed Results and Test Limits
The previous section describes the verification method. This table records the outcome of the SubTrack run without turning those observations into guarantees:
| Area | Observed result | Limit |
|---|---|---|
| Provisioning | The OTel source, two enabled destinations, and uptime monitor were created through provider APIs and confirmed in their dashboards. | Available regions, permissions, and plan access are account-specific. |
| Telemetry delivery | Better Stack received 30 logs and 51 spans from controlled public traffic. | This was sampled traffic, not a complete request record. |
| Transformation correction | The first batch had 27 spans with protected URL keys under span.attributes. After correcting the VRL paths, a new batch had zero matches for the six tested sensitive patterns and keys. |
Unknown fields, future schema changes, and untested application messages remain possible. |
| Uptime | The public English homepage monitor changed to up. |
No real outage or alert-delivery response was tested. |
| Traffic scope | Controlled requests targeted the public Worker route used for this test. | Authenticated paths, D1, R2, KV, scheduled jobs, Stripe, Resend, and Web Push were not exercised end to end. |
Troubleshooting the First Delivery
| Symptom | Check first |
|---|---|
| Cloudflare shows Never run | Confirm the Worker is receiving traffic, the destination name exactly matches Wrangler, and the sampling rate has produced an event. |
| Cloudflare shows Error | Recheck the /v1/logs or /v1/traces endpoint and the Authorization: Bearer … header. |
| Logs arrive but traces do not | Confirm the trace destination is enabled separately and referenced under [observability.traces]. |
Better Stack shows _ingest.transform_error |
Use Test transformation and remove fallible VRL operations or handle their errors before saving. |
| Sensitive fields still appear | Inspect the actual JSON nesting. A rule for .attributes will not remove the same key under .span.attributes. |
| The uptime monitor remains pending or down | Confirm the public URL returns a 2XX response, redirects are handled as intended, and TLS verification succeeds. |
Operational Limits Before Production
- This path exports logs and traces, not Worker infrastructure or custom metrics through the same Cloudflare OTel destination.
- Sampling can miss rare requests and does not guarantee a matching log for every sampled trace.
- Pre-ingestion VRL reduces stored sensitive data but cannot cover unknown fields or unsafe application messages automatically.
- Retention, region, access control, and token rotation remain account-specific operational decisions.
- This setup does not establish Better Stack as a replacement for Sentry or another error-focused workflow.
How to Pause or Roll Back the Export
To stop sending new Worker logs and traces while keeping the Cloudflare destinations available for later reuse, disable both datasets and redeploy:
[observability.traces]
enabled = false

[observability.logs]
enabled = false
npx wrangler deployConfirm that the destination delivery timestamps stop updating. If the integration will not be used again, disable the Worker references first, deploy that change, and only then delete the destinations from Cloudflare.
Uptime monitoring is independent of telemetry export. Pause or delete the monitor separately in Better Stack if you also want external checks to stop.
Production Completion Checklist
Use this checklist before declaring your own setup production-ready:
- Inventory every Cloudflare-generated field and every application
consolemessage likely to be exported. - Remove secrets and direct identifiers at the application source where possible.
- Add source transformations for known URLs, headers, query text, e-mail addresses, and IP addresses.
- Choose sampling and Cloudflare retention intentionally; do not copy the tested values without reviewing traffic volume and cost.
- Generate controlled traffic through public, login, D1, R2, KV, and scheduled paths.
- Inspect the resulting Better Stack fields for unexpected values.
- Test one alert without creating a real customer-facing outage.
- Record retention, region, deletion, access, and token-rotation responsibilities.
Final Recommendation
Better Stack was easy to provision for this Cloudflare Worker. The source, two OTLP destinations, and a working uptime monitor were all created without changing the SvelteKit runtime code.
The main decision is not whether the integration can be enabled. It can. The decision is whether the exported event shapes, sampling rate, retention, and regional storage meet your privacy and operational requirements.
For a small paid Workers project, start with uptime monitoring because it is low-risk and immediately useful. Add sampled logs and traces only after reviewing the payload boundary. Keep Sentry or another error-focused tool until Better Stack has been tested against the failure workflows you actually use.
Official Sources Reviewed
We reviewed these English-language provider pages on August 18, 2026. The source links below are not affiliate links.
- Better Stack: cloudflare workers opentelemetry setup and create a telemetry source api and telemetry api authentication and vrl transformations and live tail query language and create an uptime monitor api and uptime api authentication and pricing
- Cloudflare: exporting opentelemetry data from workers and create a workers observability destination api and workers traces